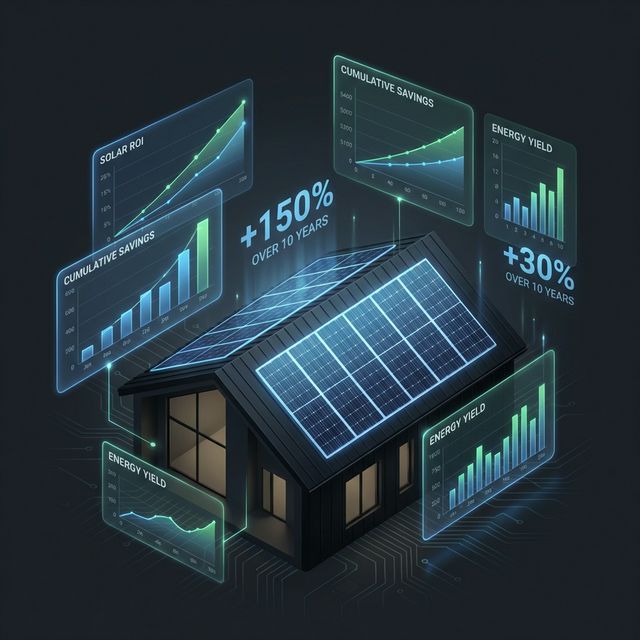
📈 2026 ROI Snapshot
- The Upfront Cost: The national average cost for a 10 kW solar panel system has stabilized at around $26,500 before incentives.
- Tax Credit Impact: The 30% Residential Clean Energy Credit remains the absolute linchpin, driving average net costs down to a much more palatable $18,550.
- The Payback Window: Average payback periods have shrunk to 7.8 years—faster than historical norms—due primarily to double-digit increases in baseline grid electricity rates over the last 24 months.
- State Variations: Local policies dictate exactly and directly the profitability. Consumers in net-metering-friendly zones yield ROI double those in restricted grid markets.
Installing solar panels feels like buying future independence. In 2026, however, smart consumers understand that independence is an economic calculation rather than an emotional purchase. The sales pitches for rooftop solar are louder than ever, promising zero-dollar electricity bills and immediate cash rebates. But when you bypass the marketing brochures and isolate the actual financial mechanics, what does the ROI of solar panels in 2026 truly look like?
To find out, we collected and analyzed cross-sectional data encompassing installation costs, federal tax policies, historical degradation rates, and the recent explosive trajectory of utility pricing.
1. The True Cost of Installation in 2026
We are well past the early-adopter phase of consumer solar. Consequently, equipment prices for photovoltaic (PV) panels have largely commoditized. While the hardware itself is cheap, "soft costs"—which include permitting, labor, marketing, and supply-chain logistics for the local installer—continue to constitute massive segments of your final quote.
As of Q1 2026, a standard 10 kilowatt (kW) system, which typically covers 100% of an average single-family home's energy usage, costs roughly $26,500. Of course, costs vary structurally based on whether you are simply mounting panels or integrating an auxiliary battery storage system like a Tesla Powerwall or Enphase IQ.
When you include a 10-15 kWh home battery (an increasingly common addition to hedge against peak-hour utility surcharges), the upfront capital expenditure rapidly balloons to an average of $38,000 to $42,000.
2. The 30% Tax Credit Mechanic
If there is one absolute truth to the economics of renewable energy, it is this: The U.S. consumer solar market exists on the back of the Residential Clean Energy Credit (ITC). Secured under the Inflation Reduction Act to remain at 30% through 2032, this federal incentive dramatically transforms the spreadsheet.
It's vital to note that this is a non-refundable tax credit. If you purchase our hypothetical $26,500 system, you generate an $7,950 tax credit. This effectively lowers your real out-of-pocket cost to $18,550. However, because it is non-refundable, you only realize this cash value if you possess sufficient federal tax liability to offset. You can roll the balance forward into future years, but this delays your break-even velocity.
3. The Hidden Variable: Utility Inflation
If panel costs have remained relatively stagnant, why are payback periods getting shorter? The secret lies not on your roof, but in your mailbox. Utility inflation is the single most powerful driver pushing the ROI of solar panels higher.
Historically, grid electricity costs rose at approximately 2% to 3% annually. Over the past three years, driven by fossil fuel volatility, localized grid upgrades, and natural gas surges, many American markets have witnessed compound utility rate hikes exceeding 10% year-over-year.
When computing ROI, solar panels effectively lock in your cost of electricity for the next 25 years. Every time your local utility raises rates, the "dividends" you earn from your solar asset mechanically increase. In 2026, buying solar is functionally acting as a long-term hedge against hyper-inflating local utility monopolies.
4. The Net-Metering Battles
Not all sunshine is created equal. Your geographic location in 2026 ultimately dictates the viability of your investment entirely through your state's net energy metering (NEM) policy.
In legacy markets with 1:1 net metering, the utility company credits you at full retail rate for every excess kilowatt-hour your panels generated and pumped back into the grid during peak sunshine. In these paradises, ROI is spectacular.
However, utility companies are fighting back. California's NEM 3.0 was the warning shot, drastically slashing the export rate compensated to solar owners by up to 75%. If you live in a location that has pivoted to wholesale compensation, the economics of solar demand coupling the panels with an expensive battery to store and self-consume your energy, rather than exporting it for pennies.
The ROI Verdict
If you have access to a roof with minimal shading, plan to stay in your home for at least a decade, and possess the tax liability to harness the 30% federal credit, solar energy in 2026 operates as an exceptionally sound alternative asset. Achieving an 8% to 12% annualized return—largely tax-free—outpaces almost safe-haven yields and acts as a fortress against utility inflation.
Frequently Asked Questions
How did the 2026 tax code impact solar credits?
The 30% Residential Clean Energy Credit remains fully intact under the IRA for systems installed between 2022 and 2032. It applies comprehensively to panels, labor, and integrated battery storage.
Does leasing solar panels make sense financially?
From an ROI perspective, no. Power Purchase Agreements (PPAs) and solar leases provide localized monthly relief, but the leasing company claims the 30% federal tax credit and monetizes the long-term utility inflation gap, capping your financial benefit.
Do solar panels increase home value?
Yes. Data from Zillow and the Lawrence Berkeley National Laboratory consistently demonstrate that homes with fully owned (not leased) solar arrays appraise an average of 4.1% higher than comparable non-solar properties.